
The cumulative value of merchandise exports during FY 2024-25 (April-March) was US$ 437.42 Billion, registering a positive growth of 0.08%, as compared to US$ 437.07 Billion during FY 2023-24 (April-March).
The cumulative Non-Petroleum exports in FY 2024-25 (April-March) valued at US$ 374.08 Billion registered an increase of 6.0% as compared to US$ 352.92 Billion in FY 2023-24
Major drivers of merchandise exports growth in FY 2024-25 (April-March) include Coffee, Tobacco, Electronic Goods, Rice, Jute Mfg. including Floor Covering, Meat, dairy & poultry products, Tea, Carpet, Plastic & Linoleum, RMG of all Textiles, Drugs & Pharmaceuticals, Cereal preparations & miscellaneous processed items, Mica, Coal & Other Ores, Minerals including processed minerals, Engineering Goods and Fruits & Vegetables.
Coffee exports increased by 40.37% from US$ 1.29 Billion in FY 2023-24 (April-March) to US$ 1.81 Billion in FY 2024-25 (April-March).
Tobacco exports increased by 36.53% from US$ 1.45 Billion in FY 2023-24 (April-March) to US$ 1.98 Billion in FY 2024-25 (April-March).
Electronic Goods exports increased by 32.47% from US$ 29.12 Billion in FY 2023-24 (April-March) to US$ 38.58 Billion in FY 2024-25 (April-March).
Rice exports increased by 19.73% from US$ 10.42 Billion in FY 2023-24 (April-March) to US$ 12.47 Billion in FY 2024-25 (April-March).
Jute Mfg. including Floor Covering exports increased by 13.35% from US$ 0.34 Billion in FY 2023-24 (April-March) to US$ 0.38 Billion in FY 2024-25 (April-March).
Meat, dairy & poultry products exports increased by 12.57% from US$ 4.53 Billion in FY 2023-24 (April-March) to US$ 5.1 Billion in FY 2024-25 (April-March).
Tea exports increased by 11.84% from US$ 0.83 Billion in FY 2023-24 (April-March) to US$ 0.92 Billion in FY 2024-25 (April-March).
Carpet exports increased by 10.46% from US$ 1.4 Billion in FY 2023-24 (April-March) to US$ 1.54 Billion in FY 2024-25 (April-March).
Plastic & Linoleum exports increased by 10.23% from US$ 8.09 Billion in FY 2023-24 (April-March) to US$ 8.92 Billion in FY 2024-25 (April-March).
RMG of all Textiles exports increased by 10.03% from US$ 14.53 Billion in FY 2023-24 (April-March) to US$ 15.99 Billion in FY 2024-25 (April-March).
Drugs & Pharmaceuticals exports increased by 9.39% from US$ 27.85 Billion in FY 2023-24 (April-March) to US$ 30.47 Billion in FY 2024-25 (April-March).
Cereal preparations & miscellaneous processed items exports increased by 8.71% from US$ 2.85 Billion in FY 2023-24 (April-March) to US$ 3.1 Billion in FY 2024-25 (April-March).
Mica, Coal & Other Ores, Minerals including processed minerals exports increased by 6.95% from US$ 4.68 Billion in FY 2023-24 (April-March) to US$ 5.01 Billion in FY 2024-25 (April-March).
Engineering Goods exports increased by 6.74% from US$ 109.3 Billion in FY 2023-24 (April-March) to US$ 116.67 Billion in FY 2024-25 (April-March).
Fruits & Vegetables exports increased by 5.67% from US$ 3.66 Billion in FY 2023-24 (April-March) to US$ 3.87 Billion in FY 2024-25 (April-March).
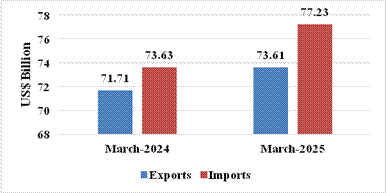
India’s total exports (Merchandise and Services combined) for March 2025* is estimated at US$ 73.61 Billion, registering a positive growth of 2.65 percent vis-à-vis March 2024. Total imports (Merchandise and Services combined) for March 2025* is estimated at US$ 77.23 Billion, registering a positive growth of 4.90 percent vis-à-vis March 2024.
Table 1: Trade during March 2025*
| March 2025
(US$ Billion) |
March 2024
(US$ Billion) |
||
| Merchandise | Exports | 41.97 | 41.69 |
| Imports | 63.51 | 57.03 | |
| Services* | Exports | 31.64 | 30.01 |
| Imports | 13.73 | 16.60 | |
| Total Trade
(Merchandise +Services) * |
Exports | 73.61 | 71.71 |
| Imports | 77.23 | 73.63 | |
| Trade Balance | -3.63 | -1.92 |
* Note: The latest data for services sector released by RBI is for February 2025. The data for March 2025 is an estimation, which will be revised based on RBI’s subsequent release. (ii) Data for FY 2023-24 (April-March) and April-December 2024 has been revised on pro-rata basis using quarterly balance of payments data.
Fig 1: Total Trade during March 2025*
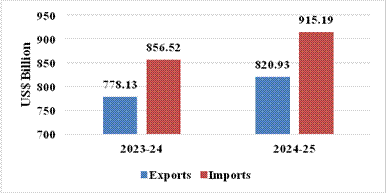
- India’s total exports during FY 2024-25 (April-March)* is estimated at US$ 820.93 Billion registering a positive growth of 5.50 percent. Total imports during FY 2024-25 (April-March)* is estimated at US$ 915.19 Billion registering a growth of 6.85 percent.
Table 2: Trade during FY 2024-25 (April-March)*
| FY 2024-25
(US$ Billion) |
FY 2023-24
(US$ Billion) |
||
| Merchandise | Exports | 437.42 | 437.07 |
| Imports | 720.24 | 678.21 | |
| Services* | Exports | 383.51 | 341.06 |
| Imports | 194.95 | 178.31 | |
| Total Trade
(Merchandise +Services) * |
Exports | 820.93 | 778.13 |
| Imports | 915.19 | 856.52 | |
| Trade Balance | -94.26 | -78.39 |
Fig 2: Total Trade during FY 2024-25 (April-March)*
MERCHANDISE TRADE
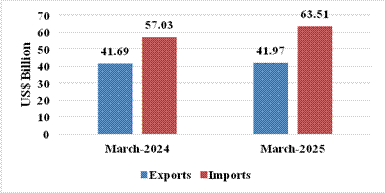
- Merchandise exports during March 2025 were US$ 41.97 Billion as compared to US$ 41.69 Billion in March 2024.
- Merchandise imports during March 2025 were US$ 63.51 Billion as compared to US$ 57.03 Billion in March 2024.
Fig 3: Merchandise Trade during March 2025
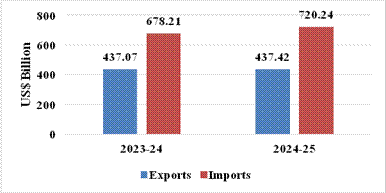
- Merchandise exports during FY 2024-25 (April-March) were US$ 437.42 Billion as compared to US$ 437.07 Billion during FY 2023-24 (April-March).
- Merchandise imports during FY 2024-25 (April-March) were US$ 720.24 Billion as compared to US$ 678.21 Billion during FY 2023-24 (April-March).
- Merchandise trade deficit during FY 2024-25 (April-March) was US$ 282.83 Billion as compared to US$ 241.14 Billion during FY 2023-24 (April-March).
Fig 4: Merchandise Trade during FY 2024-25 (April-March)
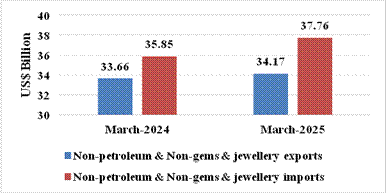
- Non-petroleum and non-gems & jewellery exports in March 2025 were US$ 34.17 Billion compared to US$ 33.66 Billion in March 2024.
- Non-petroleum, non-gems & jewellery (gold, silver & precious metals) imports in March 2025 were US$ 37.76 Billion compared to US$ 35.85 Billion in March 2024.
Table 3: Trade excluding Petroleum and Gems & Jewellery during March 2025
March 2025(US$ Billion) |
March 2024
(US$ Billion) |
|
| Non- petroleum exports | 37.07 | 36.28 |
| Non- petroleum imports | 44.50 | 40.68 |
| Non-petroleum & Non-Gems & Jewellery exports | 34.17 | 33.66 |
| Non-petroleum & Non-Gems & Jewellery imports | 37.76 | 35.85 |
Note: Gems & Jewellery Imports include Gold, Silver & Pearls, precious & Semi-precious stones
Fig 5: Trade excluding Petroleum and Gems & Jewellery during March 2025
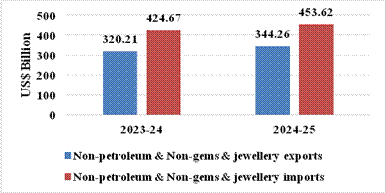
- Non-petroleum and non-gems & jewellery exports in FY 2024-25 (April-March) were US$ 344.26 Billion, compared to US$ 320.21 Billion in FY 2023-24 (April-March).
- Non-petroleum, non-gems & jewellery (gold, silver & precious metals) imports in FY 2024-25 (April-March) were US$ 453.62 Billion, compared to US$ 424.67 Billion in FY 2023-24 (April-March).
Table 4: Trade excluding Petroleum and Gems & Jewellery during FY 2024-25 (April-March)
FY 2024-25(US$ Billion) |
FY 2023-24
(US$ Billion) |
|
| Non- petroleum exports | 374.08 | 352.92 |
| Non- petroleum imports | 534.46 | 499.48 |
| Non-petroleum & Non Gems & Jewellery exports | 344.26 | 320.21 |
| Non-petroleum & Non Gems & Jewellery imports | 453.62 | 424.67 |
Note: Gems & Jewellery Imports include Gold, Silver & Pearls, precious & Semi-precious stones
Fig 6: Trade excluding Petroleum and Gems & Jewellery during FY 2024-25 (April-March)
SERVICES TRADE
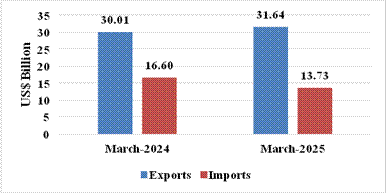
- The estimated value of services export for March 2025* is US$ 31.64 Billion as compared to US$ 30.01 Billion in March 2024.
- The estimated value of services imports for March 2025* is US$ 13.73 Billion as compared to US$ 16.60 Billion in March 2024.
Fig 7: Services Trade during March 2025*
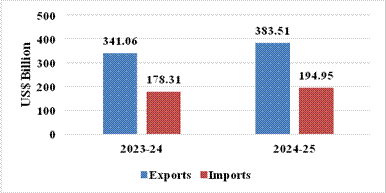
- The estimated value of service exports during FY 2024-25 (April-March)* is US$ 383.51 Billion as compared to US$ 341.06 Billion in FY 2023-24 (April-March).
- The estimated value of service imports during FY 2024-25 (April-March)* is US$ 194.95 Billion as compared to US$ 178.31 Billion in FY 2023-24 (April-March).
- The services trade surplus for FY 2024-25 (April-March)* is US$ 188.57 Billion as compared to US$ 162.75 Billion in FY 2023-24 (April-March).
Fig 8: Services Trade during FY 2024-25 (April-March)*
- Exports of Coffee (39.2%), Drugs & Pharmaceuticals (31.21%), Electronic Goods (29.57%), Marine Products (28.56%), Jute Mfg. Including Floor Covering (21.67%), Meat, Dairy & Poultry Products (16.62%), Tobacco (13.95%), Tea (11.25%), Gems & Jewellery (10.62%), Fruits & Vegetables (8.57%), Rice (7.62%), Carpet (6.52%), Mica, Coal & Other Ores, Minerals Including Processed Minerals (6.35%), Rmg Of All Textiles (3.97%), Leather & Leather Products (3.48%), Cereal Preparations & Miscellaneous Processed Items (3.35%), Cotton Yarn/Fabs./Made-Ups, Handloom Products Etc. (2.16%), and Plastic & Linoleum (1.56%) record positive growth during March 2025 over the corresponding month of last year.
- Exports of Tea (11.84%), Coffee (40.37%), Rice (19.73%), Tobacco (36.53%), Spices (4.78%), Fruits & vegetables (5.67%), Cereal preparations & miscellaneous processed items (8.71%), Marine products (0.45%), Meat, dairy & poultry products (12.57%), Mica, coal & other ores, minerals including processed minerals (6.95%), Leather and leather products (2.06%), Drugs and pharmaceuticals (9.39%), engineering goods (6.74%), Electronics goods (32.47%), Cotton yarn/fabs/makeups etc (3.19%), Man-made/ yarn/Fabs/made ups etc (4.07%), RMG of Textiles (10.03%), Jute Mfg. including Floor Covering (13.35%), Carpet (10.46%), and Plastic & Linoleum (10.23%) registered positive growth during FY 2024-25 over the previous FY 2023-24.
- Imports of Project Goods (-87.25%), Silver (-85.39%), Coal, Coke & Briquettes, Etc. (-30.18%), Transport Equipment (-25.53%), Pulses (-23.45%), Newsprint (-17.99%), Pearls, Precious & Semi-Precious Stones (-13.77%) and Pulp and Waste Paper (-11.8%) record negative growth during March 2025 over the corresponding month of last year.
- Imports of Fertilisers, Crude & Manufactured (-2.21%), Coal, coke & briquettes (20.03%), Dyeing/tanning/colouring materials (-13.42%), Newsprint (-2.71%), Pearls, precious & semi-precious stones (-24.41%), Iron & Steel (-4.61%), Project goods (-18.45%), and Silver (-11.24%) registered negative growth during FY 2024-25 over the previous year FY 2023-24.
- Services exports is estimated to grow by 12.45 percent during FY 2024-25 (April-March)* over FY 2023-24 (April-March).
- Top 5 export destinations, in terms of change in value, exhibiting positive growth in March 2025 vis a vis March 2024 are U S A (35.06%), Australia (70.81%), Kenya (98.46%), Togo (46.52%) and U K (8.43%).
- Top 5 export destinations, in terms of change in value, exhibiting positive growth in FY 2024-25 (April-March) vis a vis FY 2023-24 (April-March) are U S A (11.59%), U K (12.08%), Japan (21.12%), U Arab Emts (2.84%) and France (11.42%).
- Top 5 import sources, in terms of change in value, exhibiting growth in March 2025 vis a vis March 2024 are U Arab Emts (57.25%), China P Rp (25.02%), Saudi Arab (44.03%), Kuwait (93.8%) and Ireland (208.09%).
- Top 5 import sources, in terms of change in value, exhibiting growth in FY 2024-25 (April-March) vis a vis FY 2023-24 (April-March) are U Arab Emts (32.06%), China P Rp (11.52%), Thailand (43.99%), U S A (7.44%) and Russia (4.39%).
***
Abhishek Dayal