- India’s Health Coverage Expands Rapidly; Insurance Now Reaches Nearly Half the Population
- Institutional Deliveries Touch 96%, Marking Major Milestone in Maternal Care
- Public Healthcare Strengthens: Majority Access Free or Low-Cost Treatment Nationwide
- Early Detection Improves as Reported Ailments Rise, While Infectious Diseases Decline
- India Tackles Disease Shift: Fall in Infections, Strong Focus on Lifestyle Illnesses After 30
|
Snapshot: A. Morbidity and Hospitalization:
B. Childbirth: Nearly universal institutional deliveries were reported. About 96% of childbirths during the last 365-day period took place in hospitals. C. Health insurance coverage has expanded compared to the level reported in the previous NSS survey (2017–18), with government-sponsored schemes accounting for the majority of enrolments. |
A. INTRODUCTION
The Ministry of Statistics and Programme Implementation (MoSPI) has released the findings of the Survey on Health through a report titled ‘Household Social Consumption: Health’. The survey was conducted during January – December, 2025 as part of the 80th round of the National Sample Survey (NSS). A brief overview of the survey in terms of coverage, sample design, conceptual framework etc., is provided in the Endnote.
The Survey on Household Social Consumption: Health constitutes a significant source of empirical data, providing insights into the prevalence of morbidity, the spectrum of ailments reported by households, and the patterns of healthcare utilization across the Indian population. Data collected in this survey is used to compile indicators on morbidity, hospitalization, childbirth, and households’ out-of-pocket spending on medical and healthcare services.
The National Sample Survey (NSS) initiated exploratory morbidity studies in the 1950s, leading to the first full-scale morbidity survey in its 28th round (1973–74). Since then, another six surveys on health have been conducted, before the current survey (80th Round, 2025).
B. KEY FINDINGS
- About 13.1% persons reported illness (responded as ailing) during the last 15 days preceding the date of survey, where persons in urban areas (14.9%) reported illness slightly more than the persons in rural areas (12.2%).
- The highest proportion of individuals reporting illness was observed in the age-group 60 years & above (43.9%), followed by those aged 45–59 years (22.5%) and children aged 0–4 years (9.9%).
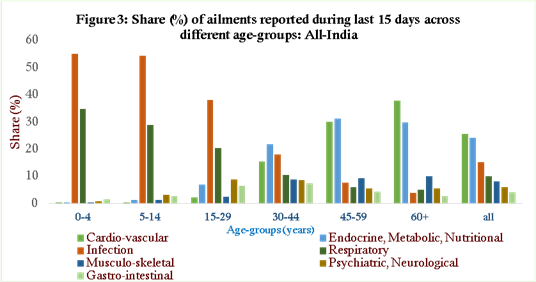
- Infections and respiratory ailments were most frequently reported during childhood and adolescence, while psychiatric/neurological and gastro-intestinal conditions peaked in young adulthood.
- Non-communicable diseases (NCDs) such as cardio-vascular (hypertension) and endocrine/metabolic (diabetes) were most frequently reported after the age of 30 years.
- The average number of instances of hospitalization (i.e. instances wherein persons received in-patient treatment) was 2.9 among 100 persons during the last 365 days preceding the date of the survey. Persons in urban areas (3.2%) reported more hospitalizations than persons in rural areas (2.7%).
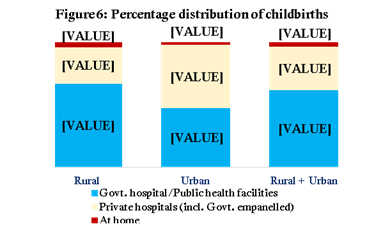
- Childbirth: Institutional deliveries accounted for nearly all births (about 96.2%) during the last 365-day period. In rural areas, 95.6% of births occurred in institutions, while only 4.4% took place at home. In urban areas, institutional deliveries were even higher at 97.8%, with just 2.2% at home.
- Both rural and urban areas showed near-universal access to ante-natal care (98%). Reporting of post-natal care was also strong, at 92% in rural areas and 95% in urban areas.
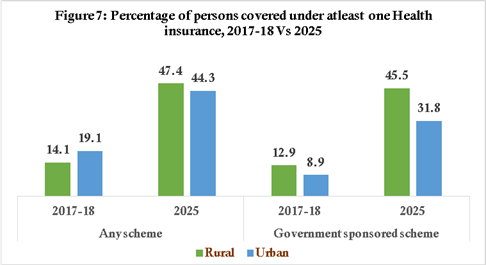
- A substantial improvement has been seen in health insurance coverage across India between 2017–18 (about 14% in rural and about 19% in urban) and 2025 (about 47% in rural and about 44% in urban).
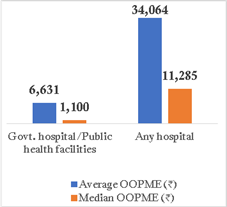
- The estimated average out-of-pocket medical expenditure per hospitalization case (excluding childbirth) during the last 365 days was about ₹34,064 (₹31,484 in rural and ₹38,688 in urban), while the median out-of-pocket medical expenditure was about ₹11,285 (₹10,500 in rural and ₹12,400 in urban).
- In public hospitals, the average expenditure per hospitalization case (excluding childbirth) at all-India level was ₹6,631 while half of the hospitalized cases treated in public hospitals involved spending of ₹1,100 or less.
- For out-patient care during the last 15 days, the average out-of-pocket medical expenditure in India was about ₹861 (Rural ₹ 847, Urban ₹884) while the median expenditure was about ₹400 (Rural ₹ 395, Urban ₹ 420).
- In public hospitals, the average expenditure per spell for out-patient care during the last 15 days was about ₹289 and the median was about ₹0, indicating that half of the treatment episodes in public hospitals were received free of cost.
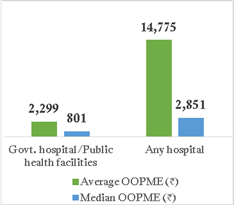
- The average out-of-pocket medical expenditure per childbirth during the last 365 days was about ₹2,299 in public hospitals, while the average expenditure in all hospitals combined was about ₹14,775. Median expenditure for childbirth in public hospitals (₹801) was less than one-third of the median expenditure in all hospitals (₹2,851).
B1. Morbidity during the last 15-day period
I. Proportion of Persons Responded as Ailing (PPRA) during last 15 days
Figure 1 shows age-specific PPRA (%) during the 15 days for six broad age-groups, separately for male, female and combined population at all India level.
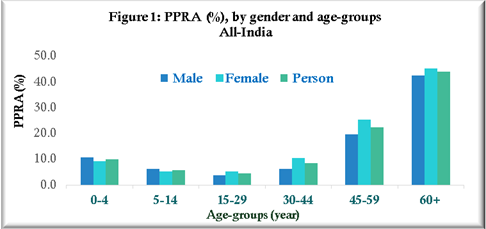
Figure 2 below shows age-specific PPRA (%) during the 15 days for six broad age-groups, separately for male, female and combined population separately for rural and urban sectors.
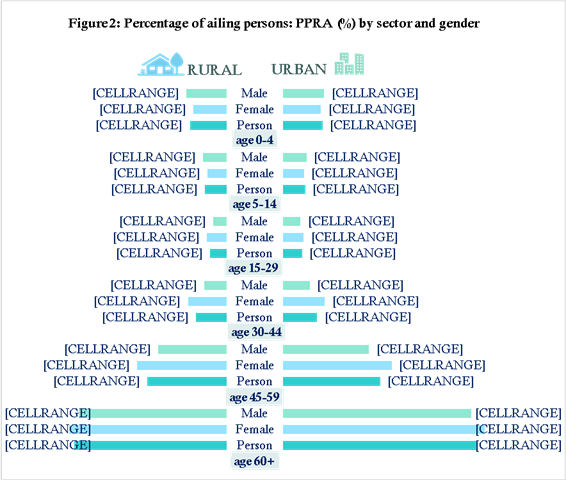
The highest rate of illness reported in the age-group 60 years & above, followed by the age-group 45–59 years and children aged 0–4 years.
II. Nature of ailments experienced during last 15 days
Figure 3 below illustrates the percentage distribution of major ailments reported by the Indian population during the last 15 days, across different age-groups.
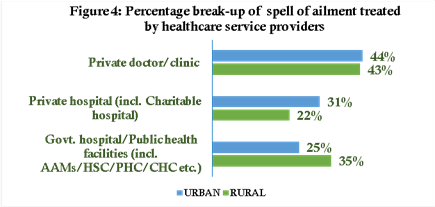
III. Out-patient care: Treatment of ailments experienced during the last 15-day period, by healthcare service provider
|
Rural residents utilised Government hospital/public health facilities (35%) more often compared with the urban residents (25%). |
B2. HOSPITALIZATION DURING the LAST 365-Day period
I. Rate (%) of hospitalization (excluding childbirth) during last 365 days by age-groups and gender
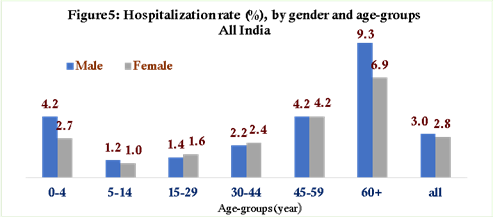
Reporting of hospitalizations begin at a high level in very young children (0-4 years), stay low through youth and young adulthood, then rise again with age, peaking in older adults.
B3. CHILDBIRTH DURING the LAST 365-Day period
Percentage distribution of childbirths by place of delivery
|
Nearly universal institutional deliveries: 96.2% overall, with only 3.8% of births occurring at home. |
B4. POPULATION COVERED BY HEALTH INSURANCE
Percentage of persons covered under any health insurance or financing scheme: All-India
Reporting of health insurance coverage has increased. In 2017–18 (previous NSS health survey), only 14.1% of rural and 19.1% of urban people were covered. By 2025, coverage rose to 47.4% in rural areas and 44.3% in urban areas.
B5. EXPENDITURE
I. Out-of-pocket medical expenditure (OOPME) on hospitalization (in-patient care) during the last 365-day period, all India
The average out-of-pocket medical expenditure per hospitalization case along with median out-of-pocket medical expenditure are presented below.
| Medical institution | Out-pocket-medical expenditure | |
| Average (₹) | Median (₹) | |
| Govt. hospital/Public health facilities | 6,631 | 1,100 |
| Charitable/Trust/
NGO run hospital |
39,530 | 10,000 |
| Private hospital (incl. Govt. empanelled) | 50,508 | 24,000 |
| All | 34,064 | 11,285 |
Note: 1. Government hospitals/Public health facilities include HSC/PHC/CHC, AAM, etc.
2. Private hospitals empanelled under Government health financing scheme/insurance viz. AB-PMJAY, CGHS/ECHS/other Central Government health schemes (e.g., Railways etc.), State Health Insurance Schemes, State Government-supported medical reimbursement (for employees), ESIS/ESIC etc., have been considered in the ‘Private hospital’ category.
II. Out-of-pocket medical expenditure (OOPME) per institutional childbirth during the last 365-day period, All-India
The average out-of-pocket medical expenditure per hospitalisation case for childbirth along with median out-of-pocket medical expenditure is presented below.
| Medical institution | Out-pocket-medical expenditure | |
| Average (₹) | Median (₹) | |
| Govt. hospital/Public health facilities | 2,299 | 801 |
| Charitable/Trust/
NGO run hospital |
19,612 | 13,000 |
| Private hospital (incl. Govt. empanelled) | 37,630 | 32,000 |
| All | 14,775 | 2,851 |
Note: 1. Government hospitals/Public health facilities include HSC/PHC/CHC, AAM, etc.
2. Private hospitals empanelled under Government health financing scheme/insurance viz. AB-PMJAY, CGHS/ECHS/other Central Government health schemes (e.g., Railways etc.), State Health Insurance Schemes, State Government-supported medical reimbursement (for employees), ESIS/ESIC etc., have been considered in the ‘Private hospital’ category.
Endnote: A brief about the geographical coverage, sample size, sample design, conceptual framework of the Household Social Consumption: Health
A. Geographical coverage
The survey covers the rural and urban areas of the whole of India (except the villages in Andaman and Nicobar Islands, which are difficult to access).
B. Sample size
A total of 17,520 FSUs (9,575 villages and 7,945 urban blocks) were surveyed for canvassing the schedule on Health (Schedule 25.0). The number of households surveyed was 139,732 (76,296 in rural areas and 63,436 in urban areas).
C. Sample design
The survey has been conducted following a multi-stage stratified sampling design, where First Stage Units (FSUs) are UFS (Urban Frame Survey) blocks in urban areas and villages in rural areas as per Census 2011 (updated by removing those villages which are urbanized and included in the latest UFS) except for rural areas Kerala, where Panchayat wards have been taken as FSUs. The ultimate stage units (USUs) are households for both the sectors. Both the FSUs and USUs have been selected with Simple Random Sampling Without Replacement (SRSWOR). In the case of large FSUs, large villages/UFS blocks are notionally divided into smaller units of more or less equal size, known as sub-units.
D. Conceptual Framework of Key Indicators
Survey on Household Social Consumption: Health gives estimates of indicators on morbidity and hospitalization like Prevalence of morbidity, rate of hospitalization, utilization of both public and private health care facilities, household’s out‑of‑pocket spending on medical and healthcare services. The key indicators generated from the survey are defined below:
(a) Proportion of persons responded as ailing (PPRA) during the 15-day period
The ‘Proportion of Persons responded as ailing (PPRA)’ is defined as the estimated number of individuals in the population who reported an ailment during the last 15-day period, expressed as a proportion of the estimated total population. The figure is expressed as percentage.
PPRA (%)=100 X total no. of persons in population reported as ailing total number of persons

(b) Hospitalization rate
The hospitalization rate is defined as the estimated number of hospital admissions (in-patient treatments) during the last 365-day period, expressed as a proportion of the total estimated population. However, in the computation of this, cases of admission to hospital for childbirth are excluded.
Hospitalization rate (%)=100 X total number of hospital admissions during last 365 daystotal number of persons (including deceased former member who died during last 365 days)

(c) Average out-of-pocket medical expenditure per hospitalization case
Out-of-pocket medical expenditure (OOPME) = (Total Medical expenditure) – (Reimbursed amount (by insurance company or employer))
Medical Expenditure: Medical expenditure includes doctor’s/ surgeon’s fee, medicine, diagnostic tests, bed charges, other medical expenses (attendant charges, physio therapy, personal medical appliances, blood, oxygen, etc.)
Average OOPME per hospitalization case=Total‘out-of-pocket’ medical expenditureTotal number ofhospitalization cases

Note: Households (or persons within households) are segregated in sector (rural/urban) by their place of domicile, and not by the place of treatment.