- Persistent decline in urban-rural consumption difference across India’s major states continues in 2023-24
- Average MPCE on the rise across all Household types in rural and urban Areas
- Consumption Inequality drops across major states in urban and rural areas
The Ministry of Statistics and Programme Implementation (MoSPI) published the summary findings of the second of the two consecutive surveys on household consumption expenditure planned to be conducted during 2022-23 and 2023-24 on 27th December 2024 in the form of a factsheet. Prior to this, the detailed report and the unit-level data of the survey of 2022-23 was released in June 2024. The detailed report of the Household Consumption Expenditure Survey: 2023-24 (HCES:2023-24) along with the unit-level data is being released now.
HCES is designed to collect information on consumption and expenditure of households on goods and services. The survey provides data required to assess trends in economic well-being and to determine and update the basket of consumer goods and services and weights used for the calculation of the Consumer Price Index. Data collected in HCES is also used to measure poverty, inequality, and social exclusion. The Monthly Per Capita Consumption Expenditure (MPCE) compiled from HCES is the primary indicator used for most analytical purposes.
The estimates of MPCE of 2023-24 are based on the data collected from 2,61,953 Households (1,54,357 in rural areas and 1,07,596 in urban areas) in the central sample spread over all States and Union Territories in the country. As in HCES:2022-23, in HCES:2023-24 also two sets of estimates of MPCE have been generated: (i) without considering imputed values of items received free of cost by the households through various social welfare programmes and (ii) considering imputed values of items received free of cost by the households through various social welfare programmes. The first set of estimates are presented in Section A while some selected indicators on the second ones are presented in Section B[i].
Important Findings of HCES:2023-24
- The average MPCE in rural and urban India in 2023-24 has been estimated to be Rs. 4,122 and Rs. 6,996, respectively without taking into account of the values of items received free of cost by the households through various social welfare programmes.
- Considering the imputed values of items received free of cost through various social welfare programmes, theseestimates become Rs. 4,247 and Rs. 7,078respectively, for rural and urban areas.
- At all-India level, the urban-rural gap in MPCE has declined to 71% in 2022-23 from 84% in 2011-12 and it has further reduced to 70% in 2023-24.
- Among the 18 major states, the urban-rural gap in average MPCE has declined in 18 states.
- Consumption inequality, both in rural and urban areas,for almost all the 18 major states has declined in 2023-24 from the level of 2022-23. At all-India, the Gini coefficient of consumption expenditure has declined to 0.237 in 2023-24 from 0.266 in 2022-23 for rural areas and to 0.284 in 2023-24 from 0.314 in 2022-23 for urban areas.
Estimates of MPCE (without considering imputed values of items received free of cost through various social welfare programmes in HCES:2023-24)
The values of average MPCE for HCES:2023-24 and HCES:2022-23 without considering the imputed values of the items received free of cost through social transferat all-India level at currentprices and at 2011-12 prices are given in Table 1 below:
Table 1: Average MPCE (Rs.) at current Prices and 2011-12 prices |
|||||
Survey |
Period |
at current Prices |
at 2011-12 Prices |
||
Rural |
Urban |
Rural |
Urban |
||
HCES: 2023-24 |
Aug 2023- Jul 2024 |
4,122 | 6,996 |
2,079 |
3,632 |
HCES: 2022-23 |
Aug 2022- Jul 2023 |
3,773 |
6,459 |
2,008 |
3,510 |
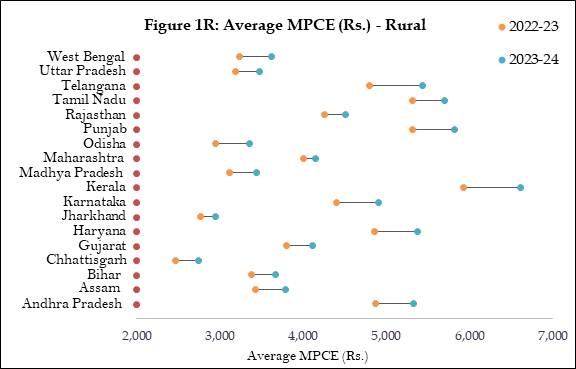
Average MPCE (Rs.) of major states in 2022-23 and 2023-24
There has been increase in average MPCE for all the 18 major states in rural and urban areas in 2023-24. The maximum increase in average MPCE in the rural areas has been observed in Odisha (about 14 % from the level of 2022-23) while in urban areas, the maximum increase has happened in Punjab (around 13% from the level of 2022-23). The least increase in average MPCE has observed in Maharashtra (about 3%) and Karnataka (about 5%) in rural and urban areas respectively.
Urban-Rural differences in MPCE across major states
A wide variation in urban-rural difference in average MPCE is observed across the 18 major states in 2022-23 as well as in 2023-24. Among these major states, there has been a decline in urban-rural gap in 11 states in 2023-24 from the level of 2022-23. The lowest urban-rural gap in 2023-24 is observed in Kerala (about 18%) and highest in Jharkhand (around 83%). Table 2 shows the average MPCE along with urban-rural gap for the major states in rural and urban areas.
| Table 2: Average MPCE and urban-rural differences in MPCE in 2022-23 and 2023-24, major States | ||||||
| Major State | 2022-23 | 2023-24 | ||||
| Average MPCE (Rs.) | Urban-Rural differences (%) in MPCE | Average MPCE (Rs.) | Urban-Rural differences (%) in MPCE | |||
| Rural | Urban | Rural | Urban | |||
| Andhra Pradesh | 4,870 | 6,782 | 39 | 5,327 | 7,182 | 35 |
| Assam | 3,432 | 6,136 | 79 | 3,793 | 6,794 | 79 |
| Bihar | 3,384 | 4,768 | 41 | 3,670 | 5,080 | 38 |
| Chhattisgarh | 2,466 | 4,483 | 82 | 2,739 | 4,927 | 80 |
| Gujarat | 3,798 | 6,621 | 74 | 4,116 | 7,175 | 74 |
| Haryana | 4,859 | 7,911 | 63 | 5,377 | 8,427 | 57 |
| Jharkhand | 2,763 | 4,931 | 78 | 2,946 | 5,393 | 83 |
| Karnataka | 4,397 | 7,666 | 74 | 4,903 | 8,076 | 65 |
| Kerala | 5,924 | 7,078 | 19 | 6,611 | 7,783 | 18 |
| Madhya Pradesh | 3,113 | 4,987 | 60 | 3,441 | 5,538 | 61 |
| Maharashtra | 4,010 | 6,657 | 66 | 4,145 | 7,363 | 78 |
| Odisha | 2,950 | 5,187 | 76 | 3,357 | 5,825 | 74 |
| Punjab | 5,315 | 6,544 | 23 | 5,817 | 7,359 | 27 |
| Rajasthan | 4,263 | 5,913 | 39 | 4,510 | 6,574 | 46 |
| Tamil Nadu | 5,310 | 7,630 | 44 | 5,701 | 8,165 | 43 |
| Telangana | 4,802 | 8,158 | 70 | 5,435 | 8,978 | 65 |
| Uttar Pradesh | 3,191 | 5,040 | 58 | 3,481 | 5,395 | 55 |
| West Bengal | 3,239 | 5,267 | 63 | 3,620 | 5,775 | 60 |
| All-India | 3,773 | 6,459 | 71 | 4,122 | 6,996 | 70 |
Share of various food and non-food item groups in total expenditure: All-India
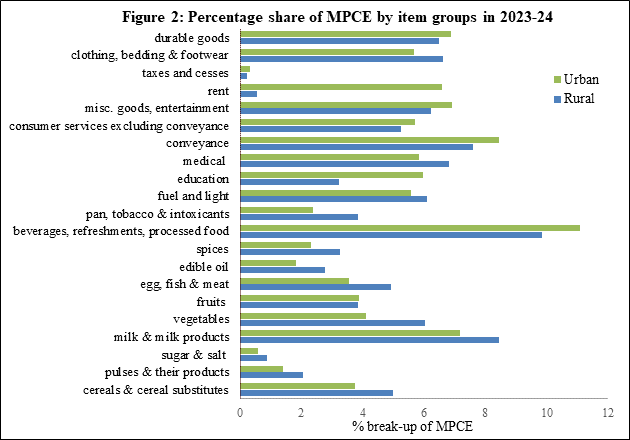
In 2023-24, in rural India, food accounted for about 47% of the value of the average rural Indian households’ consumption. Among the food items, the contribution of beverages, refreshments and processed food has been the highest (9.84%) followed by milk & milk products (8.44%) and vegetables (6.03%) in rural India. The contribution of cereals and cereal substitutes in the expenditure has been about 4.99%. Among non-food items, the maximum contribution has been of conveyance (7.59%) followed by medical (6.83%), clothing, bedding & footwear (6.63%) and durable goods (6.48%).
In urban India, the contribution of food in MPCE in 2023-24 has been about 40% and similar to rural India, the contribution of beverages, refreshments and processed food has been the highest (11.09%) in food expenditure followed by milk & milk products (7.19%) and vegetables (4.12%). The share of non-food items in MPCE in urban India has been around 60%. Conveyance with 8.46% contribution has the largest share in non-food expenditurewhile other major components of non-food expenditure in urban India are miscellaneous goods & entertainment (6.92%), durable goods (6.87%), and rent (6.58%).
Variation in MPCE across different social groups
The average MPCE for different social groups in rural and urban sectors varies significantly. The average MPCE among the social groups is the highest for the category, ‘others’ in both rural and urban areas followed by OBC both in 2022-23 and 2023-24. Table 3 shows a comparison of the average MPCE values for different social groups.
| Table 3: Average MPCE by social groups in 2022-23 and 2023-24: All-India | ||||
| Social Group | 2022-23 | 2023-24 | ||
| Average MPCE (Rs.) | Average MPCE (Rs.) | |||
| Rural | Urban | Rural | Urban | |
| Scheduled Tribe (ST) | 3,016 | 5,414 | 3,363 | 6,030 |
| Scheduled Caste (SC) | 3,474 | 5,307 | 3,878 | 5,775 |
| Other Backward Classes (OBC) | 3,848 | 6,177 | 4,206 | 6,738 |
| Others | 4,392 | 7,333 | 4,642 | 7,832 |
| all | 3,773 | 6,459 | 4,122 | 6,996 |
Variation in MPCE across different household types
In the rural areas, the households belonging to the category ‘regular wage/salaried earning in non-agriculture’ has the highest averageMPCE in 2023-24 followed by the category ‘others’ while in the urban areas the average MPCE is the highest for the category, ‘others’. The average MPCE values for different household types for all-India in 2022-23 and 2023-24 are given in Table 4.
| Table 4: Average MPCE by household type in 2022-23 and 2023-24: All-India | ||
| Household type | Average MPCE (Rs.) | |
| 2022-23 | 2023-24 | |
| Rural | ||
| self-employed in agriculture | 3,702 | 4,033 |
| self-employed in non-agriculture | 4,074 | 4,407 |
| regular wage/salaried earning in agriculture | 3,597 | 3,972 |
| regular wage/salaried earning in non-agriculture | 4,533 | 5,005 |
| casual labour in agriculture | 3,273 | 3,652 |
| casual labour in non-agriculture | 3,315 | 3,653 |
| others | 4,684 | 4,747 |
| all | 3,773 | 4,122 |
| Urban | ||
| self-employed | 6,067 | 6,595 |
| regular wage/salaried earning | 7,146 | 7,606 |
| casual labour | 4,379 | 4,964 |
| others | 8,619 | 9,159 |
| all | 6,459 | 6,996 |
Consumption inequality across major states
The Gini coefficient, a measure of consumption inequality has declined in almost for all the major states from the level of 2022-23 in urban as well as rural areas.
| Table 5: Gini coefficient of total consumption expenditure in 2022-23 and 2023-24, major states | ||||
| Major state | 2022-23 | 2023-24 | ||
| Rural | Urban | Rural | Urban | |
| Andhra Pradesh | 0.243 | 0.283 | 0.196 | 0.240 |
| Assam | 0.207 | 0.285 | 0.183 | 0.243 |
| Bihar | 0.219 | 0.278 | 0.191 | 0.232 |
| Chhattisgarh | 0.266 | 0.313 | 0.211 | 0.273 |
| Gujarat | 0.226 | 0.281 | 0.210 | 0.233 |
| Haryana | 0.234 | 0.332 | 0.187 | 0.294 |
| Jharkhand | 0.255 | 0.296 | 0.220 | 0.306 |
| Karnataka | 0.225 | 0.307 | 0.227 | 0.290 |
| Kerala | 0.286 | 0.337 | 0.255 | 0.277 |
| Madhya Pradesh | 0.230 | 0.291 | 0.208 | 0.255 |
| Maharashtra | 0.291 | 0.314 | 0.229 | 0.288 |
| Odisha | 0.231 | 0.331 | 0.221 | 0.287 |
| Punjab | 0.221 | 0.267 | 0.190 | 0.218 |
| Rajasthan | 0.283 | 0.293 | 0.241 | 0.282 |
| Tamil Nadu | 0.245 | 0.280 | 0.210 | 0.249 |
| Telangana | 0.208 | 0.279 | 0.164 | 0.256 |
| Uttar Pradesh | 0.231 | 0.294 | 0.191 | 0.269 |
| West Bengal | 0.228 | 0.305 | 0.196 | 0.285 |
| All-India | 0.266 | 0.314 | 0.237 | 0.284 |
Estimates of MPCE (considering imputed values of items received free of cost through various social welfare programmes in HCES:2023-24@)
The values of average MPCEfor HCES:2023-24 and HCES:2022-23, considering imputed values of items received free of cost through social transfer at all-India level at current prices and at 2011-12 prices are given in Table 6 below:
Table 6: Average MPCE with imputation (Rs.) at current Prices and 2011-12 prices |
||||||
Survey |
Period |
at current Prices |
at 2011-12 Prices |
|||
Rural |
Urban |
Rural |
Urban |
|||
HCES: 2023-24 |
Aug 2023- Jul 2024 |
4,247 |
7,078 |
2,142 |
3,674 |
|
HCES: 2022-23 |
Aug 2022- Jul 2023 |
3,860 |
6,521 |
2,054 |
3,544 |
|
Urban-Rural differences in MPCE across major states
As a consequence of imputation, there is an increase in the MPCE figures with imputation and this has also resulted in marginal decline in urban-rural differences in MPCE across all major states in rural as well as urban areas.
| Table 7: Average MPCE and urban-rural differences in MPCE in 2023-24, major States | ||||||
| Major state | Average MPCE (Rs.) | Average MPCE (Rs.)
with imputation |
||||
| Rural | Urban | urban-rural differences (%) in MPCE | Rural | Urban | urban-rural differences (%) in MPCE | |
| Andhra Pradesh | 5,327 | 7,182 | 35 | 5,539 | 7,341 | 33 |
| Assam | 3,793 | 6,794 | 79 | 3,961 | 6,913 | 75 |
| Bihar | 3,670 | 5,080 | 38 | 3,788 | 5,165 | 36 |
| Chhattisgarh | 2,739 | 4,927 | 80 | 2,927 | 5,114 | 75 |
| Gujarat | 4,116 | 7,175 | 74 | 4,190 | 7,198 | 72 |
| Haryana | 5,377 | 8,427 | 57 | 5,449 | 8,462 | 55 |
| Jharkhand | 2,946 | 5,393 | 83 | 3,056 | 5,455 | 79 |
| Karnataka | 4,903 | 8,076 | 65 | 5,068 | 8,169 | 61 |
| Kerala | 6,611 | 7,783 | 18 | 6,673 | 7,834 | 17 |
| Madhya Pradesh | 3,441 | 5,538 | 61 | 3,522 | 5,589 | 59 |
| Maharashtra | 4,145 | 7,363 | 78 | 4,249 | 7,415 | 75 |
| Odisha | 3,357 | 5,825 | 74 | 3,509 | 5,925 | 69 |
| Punjab | 5,817 | 7,359 | 27 | 5,874 | 7,383 | 26 |
| Rajasthan | 4,510 | 6,574 | 46 | 4,626 | 6,640 | 44 |
| Tamil Nadu | 5,701 | 8,165 | 43 | 5,872 | 8,325 | 42 |
| Telangana | 5,435 | 8,978 | 65 | 5,675 | 9,131 | 61 |
| Uttar Pradesh | 3,481 | 5,395 | 55 | 3,578 | 5,474 | 53 |
| West Bengal | 3,620 | 5,775 | 60 | 3,815 | 5,903 | 55 |
| All-India | 4,122 | 6,996 | 70 | 4,247 | 7,078 | 67 |
[i]@In HCES:2023-24, the usual practice of imputation of the value figures for consumption out of (i) home-grown/home-produced stock and (ii) gifts, loans, free collection and goods received in exchange of goods and services etc. has been continued; and accordingly, estimates of MPCE have been generated. These are presented in section A.
A provision for collection of information on the quantity of consumption for a number of items, received and consumed by the households free of cost through various social welfare programmes has been made in HCES:2022-23 and continued in HCES:2023-24. Consequently, the value figures for (i) food items: Rice, Wheat/Atta, Jowar, Bajra, Maize, Ragi, Barley, Small Millets, Pulses, Gram, Salt, Sugar, Edible Oil and (ii) non-food items: Laptop/PC, Tablet, Mobile Handset, Bicycle, Motor Cycle/Scooty, Clothing (school uniform), Footwear (school shoe etc.) received free of cost by the households through these programmes, have been imputed using an appropriate method. Accordingly, another set of estimates of MPCE considering imputed values of these items and of consumption out of home produce, free collection, gifts, loans etc. has also been compiled for HCES: 2023-24. These estimates are presented in Section B.
Pradhan Mantri Jan Aarogya Yojna (PM-JAY) or any other similar state specific schemes provide cashless access to health care services to the beneficiaries at the point of service delivery, i.e., the hospital and the beneficiary does not have any information on the cost of the services availed. For such schemes, entire premium is borne by the Government and the beneficiary makes no contribution. Since HCES is not a record-based survey, often it is not possible to ascertain the exact ailment or disease for which the benefit has been availed. Hence, in view of the complexity and appropriateness involved in imputation of the expenditure for such services, no attempt has been made to impute the expenditure of health services availed by the households free of cost.
For similar reasons, the expenditure for free education services (i.e., reimbursement/waiver of school or college fees) has also not been imputed.
****